- 积分
- 340
- 贡献
-
- 精华
- 在线时间
- 小时
- 注册时间
- 2017-10-30
- 最后登录
- 1970-1-1
|
登录后查看更多精彩内容~
您需要 登录 才可以下载或查看,没有帐号?立即注册

x
本帖最后由 喵星观天 于 2019-2-22 09:28 编辑
惊闻pyngl取代了ncl的绘图功能,打算把几年前制作的pyng命令手册发布出来。
Ngl全称:Ncl's Graphic Library
中文含义:ncl移植到了python的绘图程序
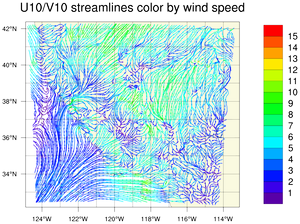
ngl绘图效果:
示例代码:
- from __future__ import print_function
- import numpy as np
- import Nio, Ngl, os, sys
- from wrf import getvar, latlon_coords, to_np
- # Read data
- filename = "wrfout_d03_2012-04-22_23_00_00"
- if(not os.path.exists(filename)):
- print("You do not have the necessary '{}' file to run this example.".format(filename))
- print("You need to supply your own WRF output file")
- print("WRF output files usually have names like '{}'".format(filename))
- sys.exit()
- # Read some WRF data
- a = Nio.open_file(filename+".nc") # Must add ".nc" suffix for Nio.open_file
- ua = getvar(a,"ua")
- va = getvar(a,"va")
- # First timestep, lowest (bottommost) level, every 5th lat/lon
- nl = 0
- nt = 0
- nstep = 5 # a stride to cull some of the streamlines
- u = ua[nl,::nstep,::nstep]
- v = va[nl,::nstep,::nstep]
- spd = np.sqrt(u**2+v**2)
- # Get the latitude and longitude points
- lat, lon = latlon_coords(ua)
- lat = to_np(lat)
- lon = to_np(lon)
- # Open file for graphics
- wks_type = "png"
- wks = Ngl.open_wks(wks_type,"wrf4")
- res = Ngl.Resources()
- res.mpDataBaseVersion = "MediumRes" # Better map outlines
- res.mpLimitMode = "LatLon" # Zoom in on map area of interest
- res.mpMinLatF = np.min(lat[:])-0.1
- res.mpMaxLatF = np.max(lat[:])+0.1
- res.mpMinLonF = np.min(lon[:])-0.1
- res.mpMaxLonF = np.max(lon[:])+0.1
- res.mpFillOn = True
- res.mpLandFillColor = "gray85"
- res.mpOceanFillColor = "transparent"
- res.mpInlandWaterFillColor = "transparent"
- res.mpGridLatSpacingF = 1
- res.mpGridLonSpacingF = 1
- #res.mpGridAndLimbOn = False
-
- res.stLineThicknessF = 3.0 # Thicker streamlines
- res.stMonoLineColor = False # Use multiple colors for streamlines
- res.tiMainString = "U10/V10 streamlines color by wind speed"
- # Necessary to overlay on map correctly.
- res.vfYArray = lat[::nstep,::nstep]
- res.vfXArray = lon[::nstep,::nstep]
- plot = Ngl.streamline_scalar_map(wks,u,v,spd,res)
- Ngl.end()
转帖教材请征求本人同意
|
-

-
ngl操作命令.pdf
643.14 KB, 阅读权限: 10, 下载次数: 515, 下载积分: 金钱 -5
ngl命令解析
评分
-
查看全部评分
|


 窥视卡
窥视卡 雷达卡
雷达卡 发表于 2019-2-18 15:28:58
 提升卡
提升卡 置顶卡
置顶卡 沉默卡
沉默卡 喧嚣卡
喧嚣卡 变色卡
变色卡 抢沙发
抢沙发 千斤顶
千斤顶 显身卡
显身卡 楼主
楼主