- 积分
- 136
- 贡献
-
- 精华
- 在线时间
- 小时
- 注册时间
- 2022-7-15
- 最后登录
- 1970-1-1
|
登录后查看更多精彩内容~
您需要 登录 才可以下载或查看,没有帐号?立即注册

x
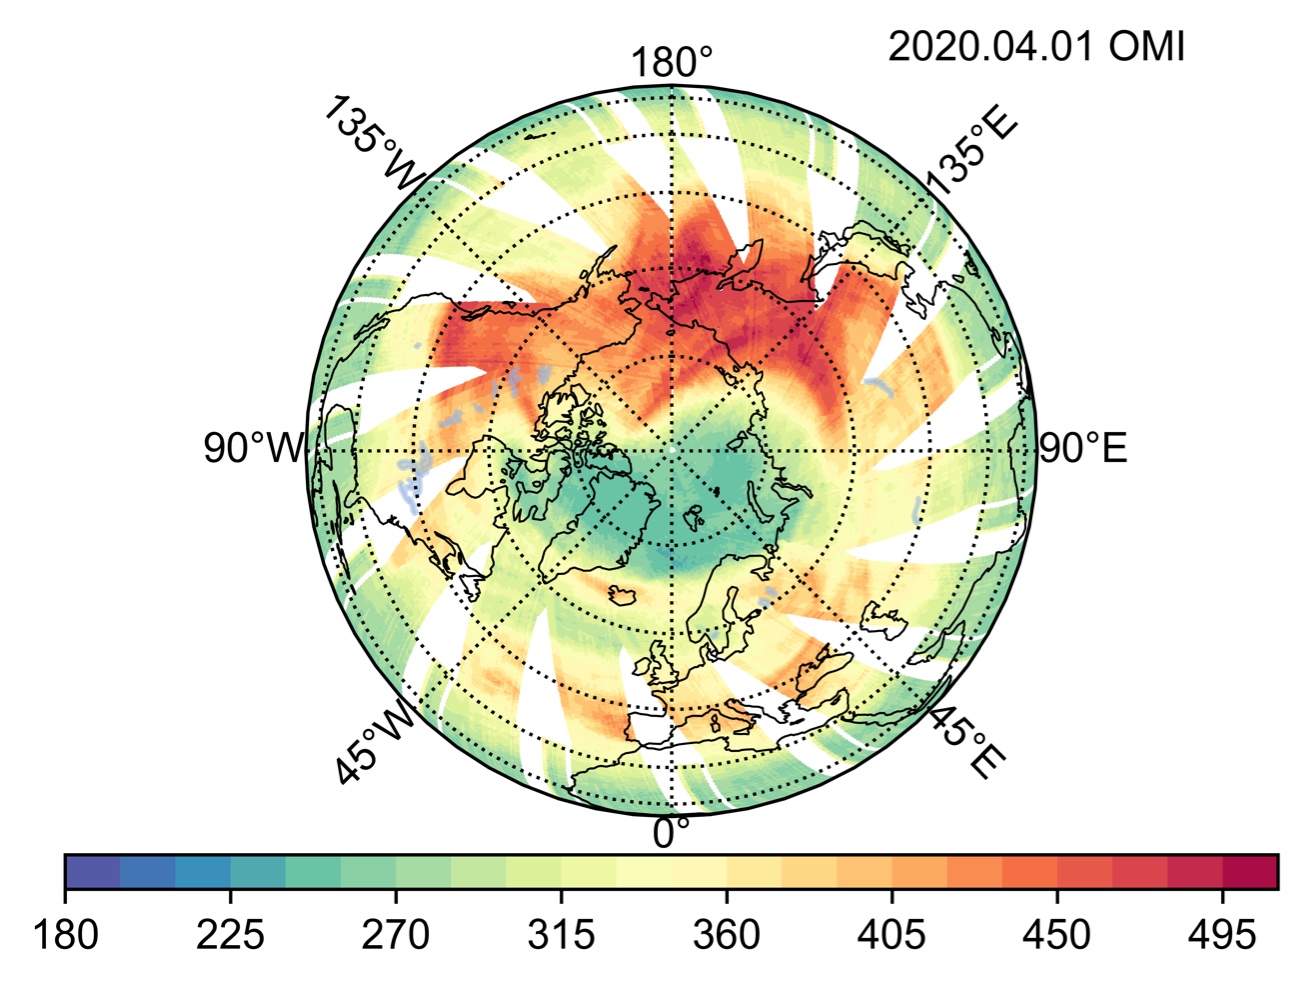
大佬们好,我想画一个纬度是40-90,经度0-360的地图,然后我不知道怎么调纬度范围,下面这个图纬度是0-90的北半球图。
import matplotlib.pyplot as plt
import matplotlib as mpl
import cartopy.crs as ccrs
import cartopy.feature as cfeature
from cartopy.mpl.ticker import LongitudeFormatter, LatitudeFormatter
from netCDF4 import Dataset
import numpy as np
import xarray as xr
from cartopy.util import add_cyclic_point
plt.rcParams['font.sans-serif']=['Arial']#显示中文
plt.rcParams['axes.unicode_minus']=False
#读取数据
data=xr.open_dataset(r'Z:\shuju\o3\nc\OMI0401.nc')
lat = data['lat'].loc[:]
lon = data['lon'][:]
o3=data['ColumnAmountO3'].loc[:,:]
#======绘图=======
fig = plt.figure(dpi=1200)
leftlon, rightlon, lowerlat, upperlat = (0, 360, 0, 90)#这里修改纬度0变成40,图形不变
proj = ccrs.Orthographic(central_longitude=0, central_latitude=90)
data_proj = ccrs.PlateCarree(central_longitude=0)
ax = fig.add_subplot(projection=proj)
ax.set_global()
ax.add_feature(cfeature.LAKES, alpha=0.5) #添加湖泊
ax.coastlines(linewidth=0.5) #添加海岸线
#ax.gridlines(draw_labels=True, x_inline=False, y_inline=False)#去掉地形
lon_formatter = LongitudeFormatter(zero_direction_label=True)
lat_formatter = LatitudeFormatter()
ax.xaxis.set_major_formatter(lon_formatter)
ax.yaxis.set_major_formatter(lat_formatter)
ax.set_title('2020.04.01 OMI',x=1,y=1,fontsize=10)
ax.gridlines(color='black', linestyle=':', xlocs = np.arange(-180,180,45), ylocs = np.arange(0,90,15),draw_labels=True)
cf = ax.contourf(lon, lat, o3, cmap='Spectral_r',levels=np.arange(180,525,15),transform=data_proj)
plt.colorbar(cf, pad=0.042, orientation='horizontal', shrink=0.87, aspect=35)
plt.show()
|
|


 窥视卡
窥视卡 雷达卡
雷达卡 发表于 2022-8-22 16:34:04
 提升卡
提升卡 置顶卡
置顶卡 沉默卡
沉默卡 喧嚣卡
喧嚣卡 变色卡
变色卡 抢沙发
抢沙发 千斤顶
千斤顶 显身卡
显身卡
 楼主
楼主