- 积分
- 136
- 贡献
-
- 精华
- 在线时间
- 小时
- 注册时间
- 2022-7-15
- 最后登录
- 1970-1-1
|
NCL
| 系统平台: |
气象家园 |
| 问题截图: |
 |
| 问题概况: |
想把正方形图变成圆形的 |
| 我看过提问的智慧: |
看过 |
| 自己思考时长(天): |
2 |
登录后查看更多精彩内容~
您需要 登录 才可以下载或查看,没有帐号?立即注册

x
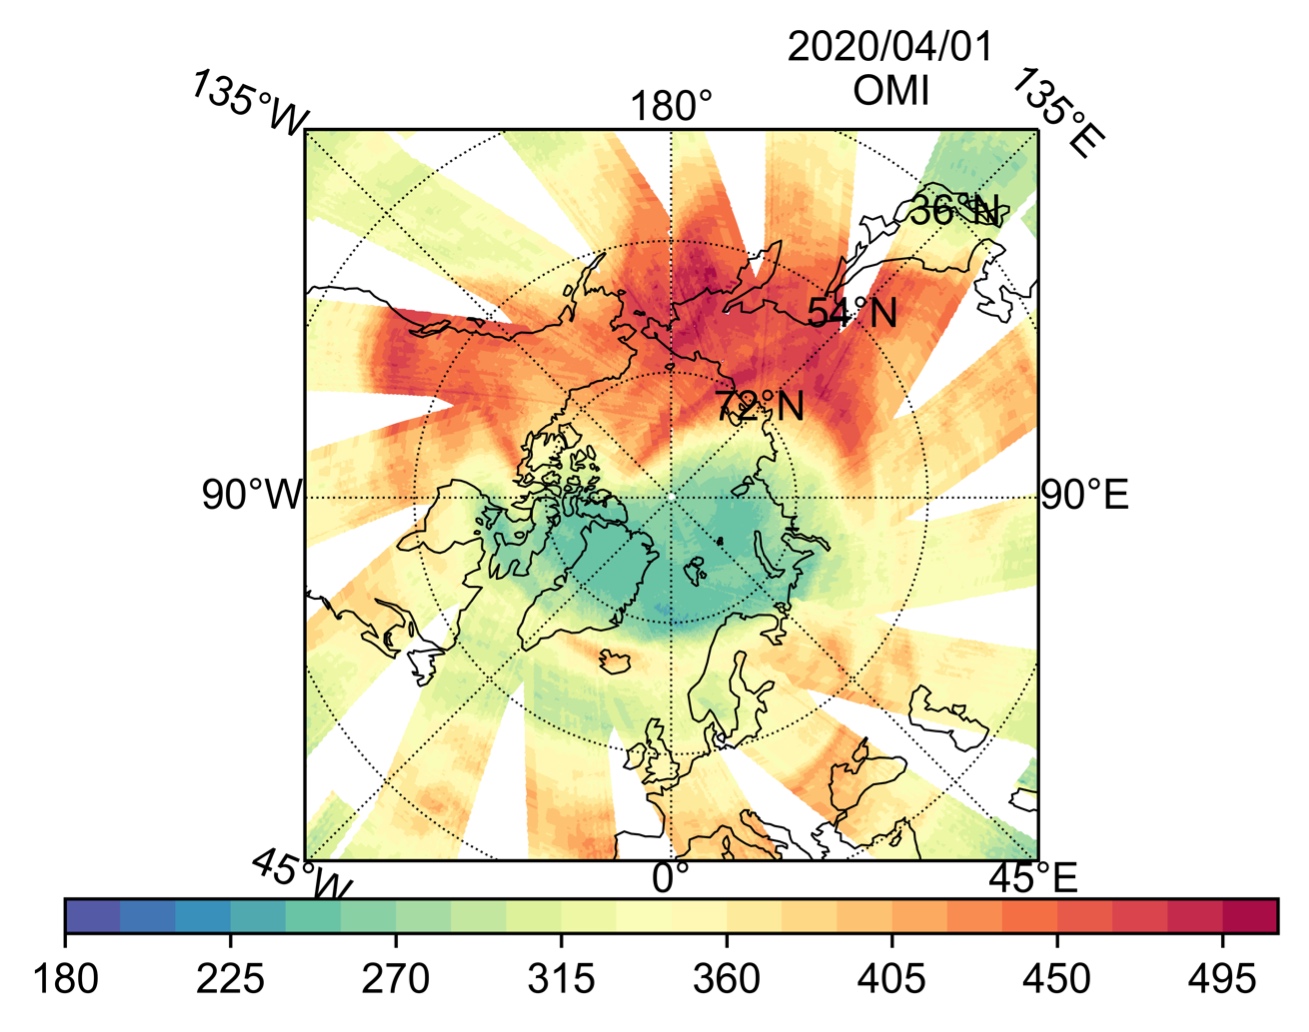
大佬们,我想把正方形图变成圆形图,纬度是40-90,经度0-360.
import matplotlib.pyplot as plt
import matplotlib as mpl
import cartopy.crs as ccrs
import cartopy.feature as cfeature
from cartopy.mpl.ticker import LongitudeFormatter, LatitudeFormatter
from netCDF4 import Dataset
import numpy as np
import xarray as xr
from cartopy.util import add_cyclic_point
plt.rcParams['font.sans-serif']=['Arial']#显示中文
plt.rcParams['axes.unicode_minus']=False
def make_map(ax):
projection = ccrs.Orthographic(central_longitude=-90,central_latitude=90)
ax.set_global()
ax.coastlines(linewidth=0.5)
'''标注坐标轴'''
# ax.set_xticks(np.linspace(-180, 180, 1), crs=projection)
# ax.set_yticks(np.linspace(-90, 90,5), crs=projection)
'''zero_direction_label=True 有度的标识,False则去掉'''
lon_formatter = LongitudeFormatter(zero_direction_label=True)
lat_formatter = LatitudeFormatter()
# ax.xaxis.set_major_formatter(lon_formatter)
# ax.yaxis.set_major_formatter(lat_formatter)
'''添加网格线'''
#gl = ax.gridlines()
#ax.grid()
return ax
data=xr.open_dataset(r'Z:\shuju\o3\nc\OMI0401.nc')
lat = data['lat'].loc[:]
lon = data['lon'][:]
o3=data['ColumnAmountO3'].loc[:,:]
data_crs = ccrs.PlateCarree()
plt.figure(dpi=1200)
ax = plt.axes(projection=ccrs.NorthPolarStereo())#在这里必须设置相对应的经纬度的中心位置,如果不设置的话是无法出图的!
ax = make_map(ax)
ax.set_extent([-180, 180, 40, 90], crs=ccrs.PlateCarree())
ax.gridlines(color='black', linestyle=':', linewidth=0.5, xlocs = np.arange(-180,180,45), ylocs = np.linspace(0,90,6),draw_labels=True)
cf = ax.contourf(lon, lat, o3, cmap='Spectral_r',levels=np.arange(180,525,15),transform=data_crs)
ax.set_title('2020/04/01\nOMI',x=0.8,y=1,fontsize=10)
plt.colorbar(cf, pad=0.042, orientation='horizontal', shrink=0.87, aspect=35)
plt.tick_params(labelsize=10)
#plt.savefig('Z:\\shuju\\o3\\fig\\map\\OMI-0401-o3.png',dpi=1200, bbox_inches='tight')
|
|
 10 金钱
10 金钱


 窥视卡
窥视卡 雷达卡
雷达卡 发表于 2022-8-22 22:19:25
 提升卡
提升卡 置顶卡
置顶卡 沉默卡
沉默卡 喧嚣卡
喧嚣卡 变色卡
变色卡 抢沙发
抢沙发 千斤顶
千斤顶 显身卡
显身卡 楼主
楼主