登录后查看更多精彩内容~
您需要 登录 才可以下载或查看,没有帐号?立即注册

x
What's new in the current release[previous releases | next release]
Version 6.2.0 - April 2, 2014 - [download]
Improvements to NetCDF, HDF, and GRIB readers
- Numerous improvements and bug fixes have been made to the NetCDF-4 file I/O:
- Fixed issues with writing NetCDF4Classic files.
- Fixed issues with reading multiple NetCDF4 files.
- Fixed issues handling groups with special characters.
- addfiles now works on NetCDF4 files.
- Variables read off HDF-EOS2 files will now have all the metadata included, without having to first read the file as an HDF file, and then as an HDF-EOS file.
- GRIB improvements:
Contouring improvements
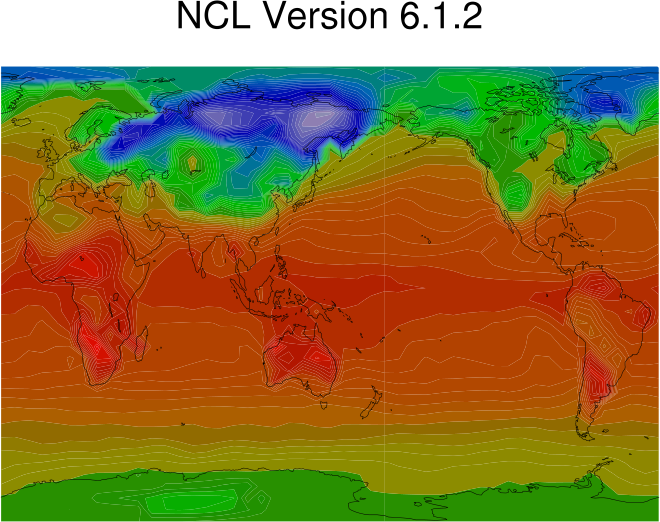
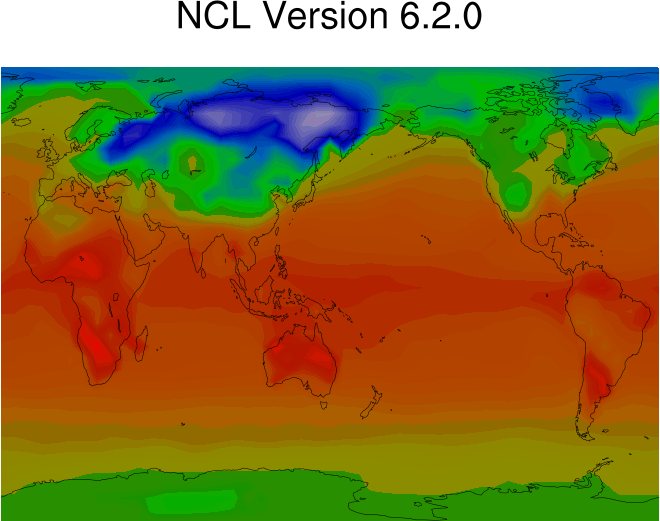
- There are significant improvements to the speed of raster contouring.
- Raster contouring now supports transparency. Once significant difference is that missing value areas will now be transparent rather than filled in the background color. Users of graphics display tools that depend on ghostscript, including gv, gs, and ImageMagick's display, should be aware that older versions of ghostscript have a bug that is sometimes triggered by raster graphics containing transparent cells output to PostScript. This bug was fixed sometime between versions 8.70 and 9.06 of ghostscript. The symptom of the bug is horizontal rows of cells that seem wrong. Update your version of ghostscript to fix this issue.
- There is alpha-level support for using OpenMP to generated raster graphics using multiple threads. Currently availablity is limited to graphics generated by using 1D values for the resources sfDataArray, sfXArray, andsfYArray and not setting sfXCellBounds, sfYCellBounds, or sfElementNodes. Set the environment variable "OMP_NUM_THREADS" to a number greater than one to activate this capability. Currently using more than 9 or so threads sometimes causes artifacts to appear in the plot. Also using map projections other than cylindrical equidistant may result in lines appearing at the edge of the blocks assigned to each thread.
- The CellFill contouring method can now render data on unstructured grids, including triangular grids, quadrilateral grids such as HOMME, and geodesic grids with 5, 6, or more sided cells. The outlines of each cell can be rendered by setting the resource cnCellFillEdgeColor to a non-transparent color. The user must specify the cell vertices using the resources sfXCellBounds and sfYCellBounds. Also to avoid errors, the resources sfXArray and sfYArray must be specified. However, this requirement will be eliminated in the future.
- In most cases, users can now have constant or near-constant fields rendered as a filled area, rather than having the contoured area remain blank. In order to activate this behavior, set the newly implemented resource, cnConstFEnableFill, to True. By default, the constant field informational text box will still appear; turn it off by setting cnConstFLabelOn to False. In the future, cnConstFEnableFill will likely default to True, with cnConstFLabelOn defaulting to False unless contour line drawing is enabled.
- Better error reporting in situations where out-of-range (lat-lon) coordinate values cannot be handled. The error message suggests a possible fix for the problem: switching to use of the triangular mesh algorithm for plotting.
Significant improvements to the speed of drawing shapefile polylines or polygons The gsn_add_shapefile_polylines and gsn_add_shapefile_polygons functions were significantly sped up via the use of a new resource called gsSegments. Previously, an object was created for every segment added, which could cause thousands of objects to be created. Now, only one object is created. We saw speed ups of 80 times faster in the case of drawing the France "Fra_adm5.shp" shapefile fromgadm.org/country which has 37,188 polyline segments. Note, too, that the use of these two functions is not really needed, since attaching shapefile polylines and polygons is now simplified. The following two segments of code are identical, assuming "plot" is some map plot that you want to attach shapefile polylines or polygons to: Method 1:
f = addfile("file.shp","r") lnres = True lnres@gsLineColor = "NavyBlue" lnres@gsSegments = f->segments(:,0) poly = gsn_add_polyline(wks, plot, f->x, f->y, lnres) draw(plot) frame(wks)Method 2:
lnres = True lnres@gsLineColor = "NavyBlue" polyid = gsn_add_shapefile_polylines(wks,plot,"file.shp",lnres) draw(plot) frame(wks)
Improvements to ESMF regridding routines
- Two new interpolation methods have been added: "neareststod" and "nearestdtos".
- When regridding to or from an unstructured grid, a triangular mesh is generated internally by NCL. This can be a slow and memory intensive operation, so a new option was added to allow the user to input their own triangular mesh via SrcTriangularMesh or DstTriangularMesh.
- Large file (opt@LargeFile=True) support is now turned on by default.
- ESMF_regrid / ESMF_regrid_gen_weights - A bug was fixed in which the "pole" option was only being recognized if you set it as "pole" and not "Pole".
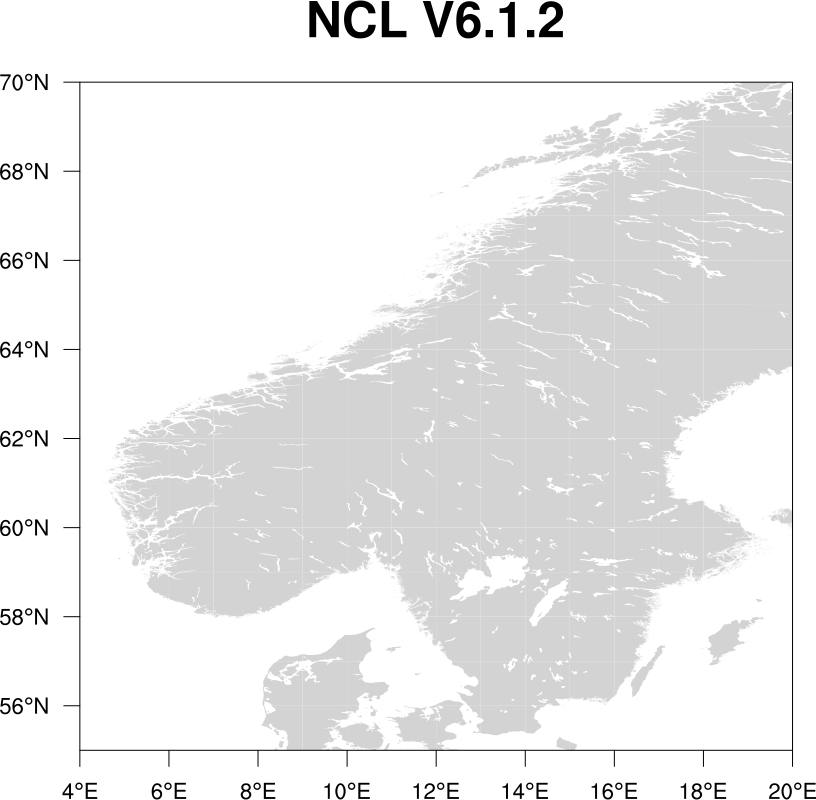
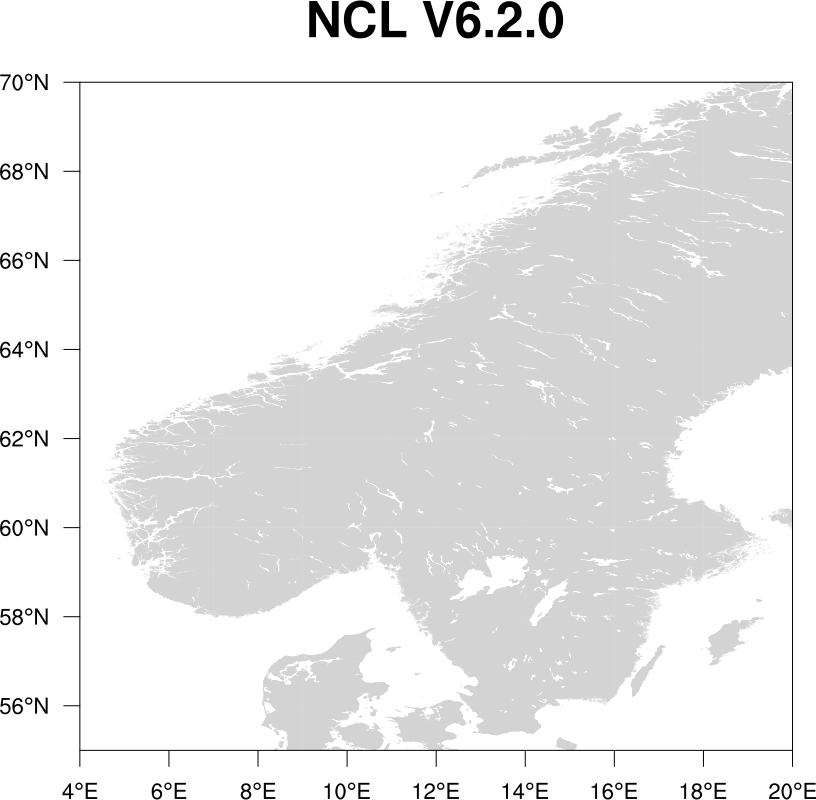
Improvement to "thin line" graphical issue
On rare occasions, plots from postscript, pdf, or SVG workstations may exhibit faint, light-colored gaps between adjacent filled regions. The effect is most noticeable when the regions are of the same color, and share a long, straight boundary. This artifact is believed to be caused by a bug in the underlying cairographics library. The problem has been reported to them. We've improved the appearance of the plots by implementing a temporary internal work-around for NCL V6.2.0. See the two sets of images below for comparison (click on either thumbnail to see the problem more clearly.) The first set of images is a modified version of the "ng4ex" example "cn05n". The second set of images were generated by this map_thin_line.ncl script.
New Functions
- area_poly_sphere - Finds the area enclosed by an arbitrary polygon on the sphere.
- calculate_monthly_values - Calculate monthly values [avg, sum, min, max] from high frequency temporal values.
- kolsm2_n - Test if two samples are compatible with coming from the same distribution using the Kolmogorov-Smirnov two sample test.
- lspoly_n - This function is the same as lspoly, except it allows you to provide a dimension on which to calculate a set of coefficients for a weighted least squares polynomial fit to the given data. lspoly always operates on the rightmost dimension.
- omega_to_w - Convert omega vertical velocity (Pa/s) to (m/s).
- print_clock - Prints the given string along with a current timestamp.
- reg_multlin_stats - Performs multiple linear regression analysis including confidence estimates and creates an ANOVA table. This is a driver which invokes the builtin reg_multlin function. It is the preferred function for performing multiple linear regression.
- regline_stats - Performs simple linear regression analysis including confidence estimates and creates an ANOVA table. It is the preferred function for performing simple linear regression.
- w_to_omega - Convert w vertical velocity (m/s) to (Pa/s).
- New WRF functions:
- wrf_omega - Calculates approximate omega, based on vertical velocity, water vapor mixing ratio, temperature, and pressure.
- wrf_virtual_temp - Calculates virtual temperature, given temperature and mixing ratio.
- wrf_wetbulb - Calculates wet bulb temperature, given pressure, temperature, and water vapor mixing ratio.
- New color-related functions:
- color_index_to_rgba - Converts one or more absolute color index values into its equivalent RGBA quadruplet. This is useful for discovering the RGBA values encoded into the high-numbered integers that may be returned from performing a getvalues call for a color-related resource such as cnFillColors. Note this function does not currently work for color indexes less than 256 that are dependent on the setting of wkColorMap.
- get_color_index - Chooses a color index for a scalar value, given a color map and a range of values.
- get_color_rgba - Chooses an RGB triplet or RGBA quadruplet for a scalar value, given a color map and a range of values.
- namedcolor2rgba - Returns the RGBA quadruplets of the given list of named colors.
- rgba_to_color_index - Converts one or more RGBA quadruplets into its equivalent absolute color index.
- span_color_indexes - Given the number of desired color values, return an array of indexes that nicely span the given color map.
- span_color_rgba - Given the number of desired color values, return an array of RGB triplets or RGBA quadruplets that nicely span the given color map.
New graphical resources
- cnConstFEnableFill - Setting this to True will force constant contour fields, or fields that fall between two contour levels, to be filled in the appropriate color or shaded pattern.
- gsnCenterStringFuncCode, gsnLeftStringFuncCode, gsnRightStringFuncCode, gsnStringFuncCode - resources for setting the function code character for the three subtitles at the top of a plot.
- gsnXYBarChartFillDotSizeF - increases the dot size in stipple-filled bar charts.
- gsnXYBarChartFillLineThicknessF - increases the thickness of lines in a pattern-filled bar chart.
- gsnXYBarChartFillScaleF - changes the fill scale for pattern-filled bar charts.
- gsnXYBarChartFillOpacityF - sets the opacity for solid-filled bar charts.
- gsnXYFillOpacities - sets an array of opacities for solid-filled bar charts which corresponds with thegsnXYFillColors array.
- gsColors - This resource allows you to set an array of fill or line colors for polygons or line segments being attached to a plot via the new gsSegments resource.
- gsSegments - This resource allows you specify the start and end of line or polygon segments via one large array. Using this resource can significantly speed up code (we saw one script run 80 times faster) that is adding thousands of segments to a plot. It is only available with polyline and polygon drawing codes likegsn_add_polyline and gsn_add_polygon.
- mpPolyMode - This new resource takes three possible values: "StandardPoly", "FastPoly", and "AutoPoly". It should be used to set what method to use when adding polygons to a map plot.
The default is "AutoPoly", meaning that the drawing code decides which type of polygon to draw based on the great circle distance of each component line segment, and on the polygon's graphic style attributes. If the great circle distance of any component line segment is greater than 10 degress or if any fill pattern other than solid is in effect, the "standard" method that was used in NCL versions 6.1.2 and earlier is used. Otherwise a faster method introduced in version 6.2.0 is used. The faster method may sometimes fail for polygons that have complicated crossing with the visible edges of curvilinear map projections.
- lbBoxSeparatorLinesOn - Setting this resource False allows you to have a perimeter line drawn around the "bar" of the LabelBar without having lines separating each component box within the bar.
New graphical output format The "SVG" format is now supported in NCL. It can be used with gsn_open_wks in the same way as other formats like "png" and "pdf":
wks = gsn_open_wks("svg","example") ; Will create "example.svg"
New color tables Over 120 new color tables were added to NCL. You can view and download these color tables now via the color table gallery. Special thanks to Nicolas Barrier of Laboratoire de Physique des Océans, Melissa Bukovsky of NCAR, and Carl Schreck of Cooperative Institute for Climate and Satellites - North Carolina for contributing these tables, which came from ColorBrewer, GMT, GrADS, matplotlib, and Ncview.
Library for generating KML output from NCL NCL_GETools is a library for generating KML output with NCL. It was developed by Mohammad Abouali during the summer 2013 SIParCS internship program. The library is being made available on a preliminary basis to gauge user interest and to gather further use-cases and requirements.
Updated functions
Bugs fixed
- A bug was fixed where byte value were being printed in hexadecimal format instead of decimal format, when using print.
- addfiles: if the aggregated time coordinate has different units in the individual aggregated files, the values are now adjusted to conform to the units of the first file in the aggregation.
- ESMF_regrid / ESMF_regrid_gen_weights - - See ESMF Regridding improvements above.
- ezfftf / ezfftb - A bug was fixed for the case where the number of points is odd.
- covcorm - A bug was fixed in which "iopt" behaved the opposite of how it was described in the documentation:
- iopt=(/0,1/) behaves as if you had set iopt=(/1,0/)
- iopt=(/1,0/) behaves as if you had set iopt=(/0,1/)
- iopt=(/0,0/) or (/1,1/) works as described
- gsn_contour_shade - A bug was fixed that didn't allow you to use the gsnShadeHigh, gsnShadeMid, andgsnShadeLow resources together.
- lspoly - This function was failing in certain cases where the input data were "scaled" down. We decided to replace this routine with a SLATEC version. It takes the same arguments, but uses a different algorithm under the hood. You can get the "old" (pre NCL V6.2.0) version of lspoly by using "lspoly_old", but we don't recommend it for regular use.
- pdfxy - Fixed a bug in which values that exactly matched the rightmost edge of the rightmost bin were not getting counted. There should be minimal effect on user results.
- poisson_grid_fill - Fixed a bug that when the data are cyclic, the leftmost boundary index was off-by-one. The bug will have little or no impact on most users.
- read_colormap_file - This function now works on any NCL color map (previously, it only worked on *.rgb color maps in $NCARG_ROOT/lib/ncarg/colormaps).
- relhum - A bug was fixed in which all variables had to have the _FillValue attribute if any one of the input variables had an _FillValue attribute. Note that there is a potential incompatible change with this fix. The return missing value is now whatever the default missing value is for the type being returned, and *not* the _FillValue associated with the input variable 't', as it was in the past.
- stat_dispersion - Fixed a bug that caused this function to fail when large arrays contained lots or all missing values.
- str_split_csv - A bug was fixed in which if you had a mix of commas and quotes, the fields were not parsed properly.
- wrf_map_overlays - A bug was fixed to correctly plot rotated lat-lon grids.
Change in HDF4 build instructions If you are planning to build NCL V6.2.0 from source code, then take note that there's a change in where it expects to find the HDF4 include files. Previously, you had to install them to an "hdf" subdirectory via a special "--includedir" option on the "configure" line. This is no longer required. This means if you are linking against previously-compiled versions of HDF4, you may need to move the include files out of "/xxxx/include/hdf" to "/xxxx/include".
|


 窥视卡
窥视卡 雷达卡
雷达卡 发表于 2014-4-3 08:59:08
 提升卡
提升卡 置顶卡
置顶卡 沉默卡
沉默卡 喧嚣卡
喧嚣卡 变色卡
变色卡 抢沙发
抢沙发 千斤顶
千斤顶 显身卡
显身卡 发表于 2014-4-3 09:03:33
 发表于 2014-4-3 09:35:18
 楼主
楼主