- 积分
- 7124
- 贡献
-
- 精华
- 在线时间
- 小时
- 注册时间
- 2017-11-26
- 最后登录
- 1970-1-1
|
登录后查看更多精彩内容~
您需要 登录 才可以下载或查看,没有帐号?立即注册

x
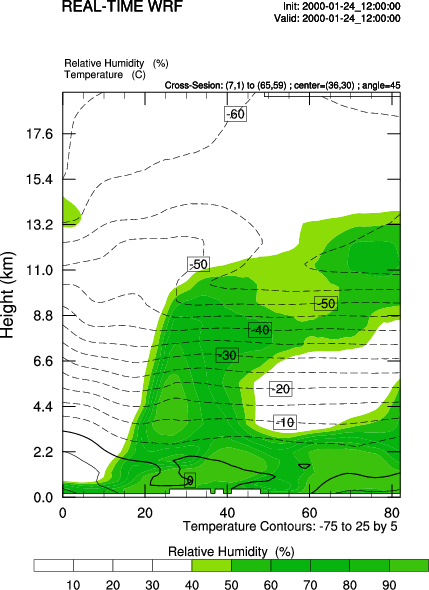
大家好!刚入手NCL,想把X轴换成经度,请问怎么修改呢?非常感谢!
load "$NCARG_ROOT/lib/ncarg/nclscripts/csm/gsn_code.ncl"
load "$NCARG_ROOT/lib/ncarg/nclscripts/wrf/WRFUserARW.ncl"
begin
;
; The WRF ARW input file.
; This needs to have a ".nc" appended, so just do it.
dir = "/wrfout/20200218/"
filename = "wrfout_d02_2020-01-24_00_00_00"
a = addfile(dir + filename + ".nc","r")
; We generate plots, but what kind do we prefer?
type = "png"
; type = "pdf"
; type = "ps"
; type = "ncgm"
wks = gsn_open_wks(type,"plt_CrossSection31")
gsn_define_colormap(wks,"WhBlGrYeRe")
; Set some basic resources
res = True
res@MainTitle = "REAL-TIME WRF"
pltres = True
;;;;;;;;;;;;;;;;;;;;;;;;;;;;;;;;;;;;;;;;;;;;;;;;;;;;;;;;;;;;;;;;
FirstTime = True
times = wrf_user_getvar(a,"times",-1) ; get times in the file
ntimes = dimsizes(times) ; number of times in the file
mdims = getfilevardimsizes(a,"P") ; get some dimension sizes for the file
nd = dimsizes(mdims)
;---------------------------------------------------------------
do it = 0,ntimes-1,2 ; TIME LOOP
print("Working on time: " + times(it) )
res@TimeLabel = times(it) ; Set Valid time to use on plots
tc = wrf_user_getvar(a,"tc",it) ; T in C
rh = wrf_user_getvar(a,"QICE",it) ; relative humidity
z = wrf_user_getvar(a, "z",it) ; grid point height
rh = rh*1000.
rh@units = "g/kg"
if ( FirstTime ) then ; get height info for labels
zmin = 0.
zmax = max(z)/1000.
nz = floattoint(zmax/2 + 1)
FirstTime = False
end if
;---------------------------------------------------------------
do ip = 1, 3 ; we are doing 3 plots, specifying different start and end points
opts = True ; setting start and end times
plane = new(4,float)
if(ip .eq. 1) then
plane = (/ 1,98, 199,98 /) ; start x;y & end x;y point
end if
if(ip .eq. 2) then
plane = (/ 2,71, 199,71 /) ; start x;y & end x;y point
end if
if(ip .eq. 3) then
plane = (/ 1,1, 199,199 /) ; start x;y & end x;y point
end if
rh_plane = wrf_user_intrp3d(rh,z,"v",plane,0.,opts)
tc_plane = wrf_user_intrp3d(tc,z,"v",plane,0.,opts)
dim = dimsizes(rh_plane) ; Find the data span - for use in labels
zspan = dim(0)
; Options for XY Plots
opts_xy = res
opts_xy@tiYAxisString = "Height (km)"
opts_xy@AspectRatio = 0.75
opts_xy@cnMissingValPerimOn = True
opts_xy@cnMissingValFillColor = 0
opts_xy@cnMissingValFillPattern = 11
opts_xy@tmYLMode = "Explicit"
opts_xy@tmYLValues = fspan(0,zspan,nz) ; Create tick marks
opts_xy@tmYLLabels = sprintf("%.1f",fspan(zmin,zmax,nz)) ; Create labels
opts_xy@tiXAxisFontHeightF = 0.020
opts_xy@tiYAxisFontHeightF = 0.020
opts_xy@tmXBMajorLengthF = 0.02
opts_xy@tmYLMajorLengthF = 0.02
opts_xy@tmYLLabelFontHeightF = 0.015
opts_xy@PlotOrientation = tc_plane@Orientation
; Plotting options for RH
opts_rh = opts_xy
opts_rh@pmLabelBarOrthogonalPosF = -0.07
opts_rh@ContourParameters = (/ 0.02, 0.24, 0.02 /)
opts_rh@cnFillOn = True
; opts_rh@cnFillColors = (/"White","White","White", \
; "White","Chartreuse","Green", \
; "Green3","Green4", \
; "ForestGreen","PaleGreen4"/)
; Plotting options for Temperature
opts_tc = opts_xy
opts_tc@cnInfoLabelOrthogonalPosF = 0.00
opts_tc@ContourParameters = (/ 5. /)
; Get the contour info for the rh and temp
contour_tc = wrf_contour(a,wks,tc_plane,opts_tc)
contour_rh = wrf_contour(a,wks,rh_plane,opts_rh)
; MAKE PLOTS
plot = wrf_overlays(a,wks,(/contour_rh,contour_tc/),pltres)
; Delete options and fields, so we don't have carry over
delete(opts_tc)
delete(opts_rh)
delete(tc_plane)
delete(rh_plane)
end do ; make next cross section
;;;;;;;;;;;;;;;;;;;;;;;;;;;;;;;;;;;;;;;;;;;;;;;;;;;;;;;;;;;;;;;;
end do ; END OF TIME LOOP
end
|
-

|


 窥视卡
窥视卡 雷达卡
雷达卡 发表于 2020-3-7 16:04:11
 提升卡
提升卡 置顶卡
置顶卡 沉默卡
沉默卡 喧嚣卡
喧嚣卡 变色卡
变色卡 抢沙发
抢沙发 千斤顶
千斤顶 显身卡
显身卡 楼主
楼主